The Hidden Cost Curve of Enterprise AI
AI infrastructure costs feel manageable at launch and surprising at scale. The compounding effect of token growth, optional operational layers, and cost volatility creates a very different budget reality than the initial estimate suggests.
Related Lab Tool
Try the interactive decision model for this topic.
An internal RAG deployment goes live with 30,000 active users, 50 prompts per user per month, and a retrieval layer pulling 12,000 input tokens per prompt. The launch-month token cost runs about $90,000. The estimate gets approved. Eight months later, the monthly invoice is approaching $1 million. Nobody changed the model. Nobody added users ahead of plan. The problem was never in the launch estimate. It was in everything the launch estimate did not include.
The Estimate That Felt Safe
Initial AI infrastructure estimates are almost always accurate for one thing: the token cost at launch scale with no operational layers and no growth accounted for. That number is real, and for the first month or two, the invoice confirms it.
The estimate becomes wrong for several reasons that are structural, not accidental. Usage grows. Governance requirements accumulate. Operational layers get added. Cost volatility means the launch number was not a floor but a P50, meaning roughly half the months will cost more.
Each of these effects is individually visible once it appears on an invoice. None of them tends to appear in the original estimate because the review process focuses on whether the base case is justified, not whether the operational envelope has been sized correctly.
The Costs That Compound
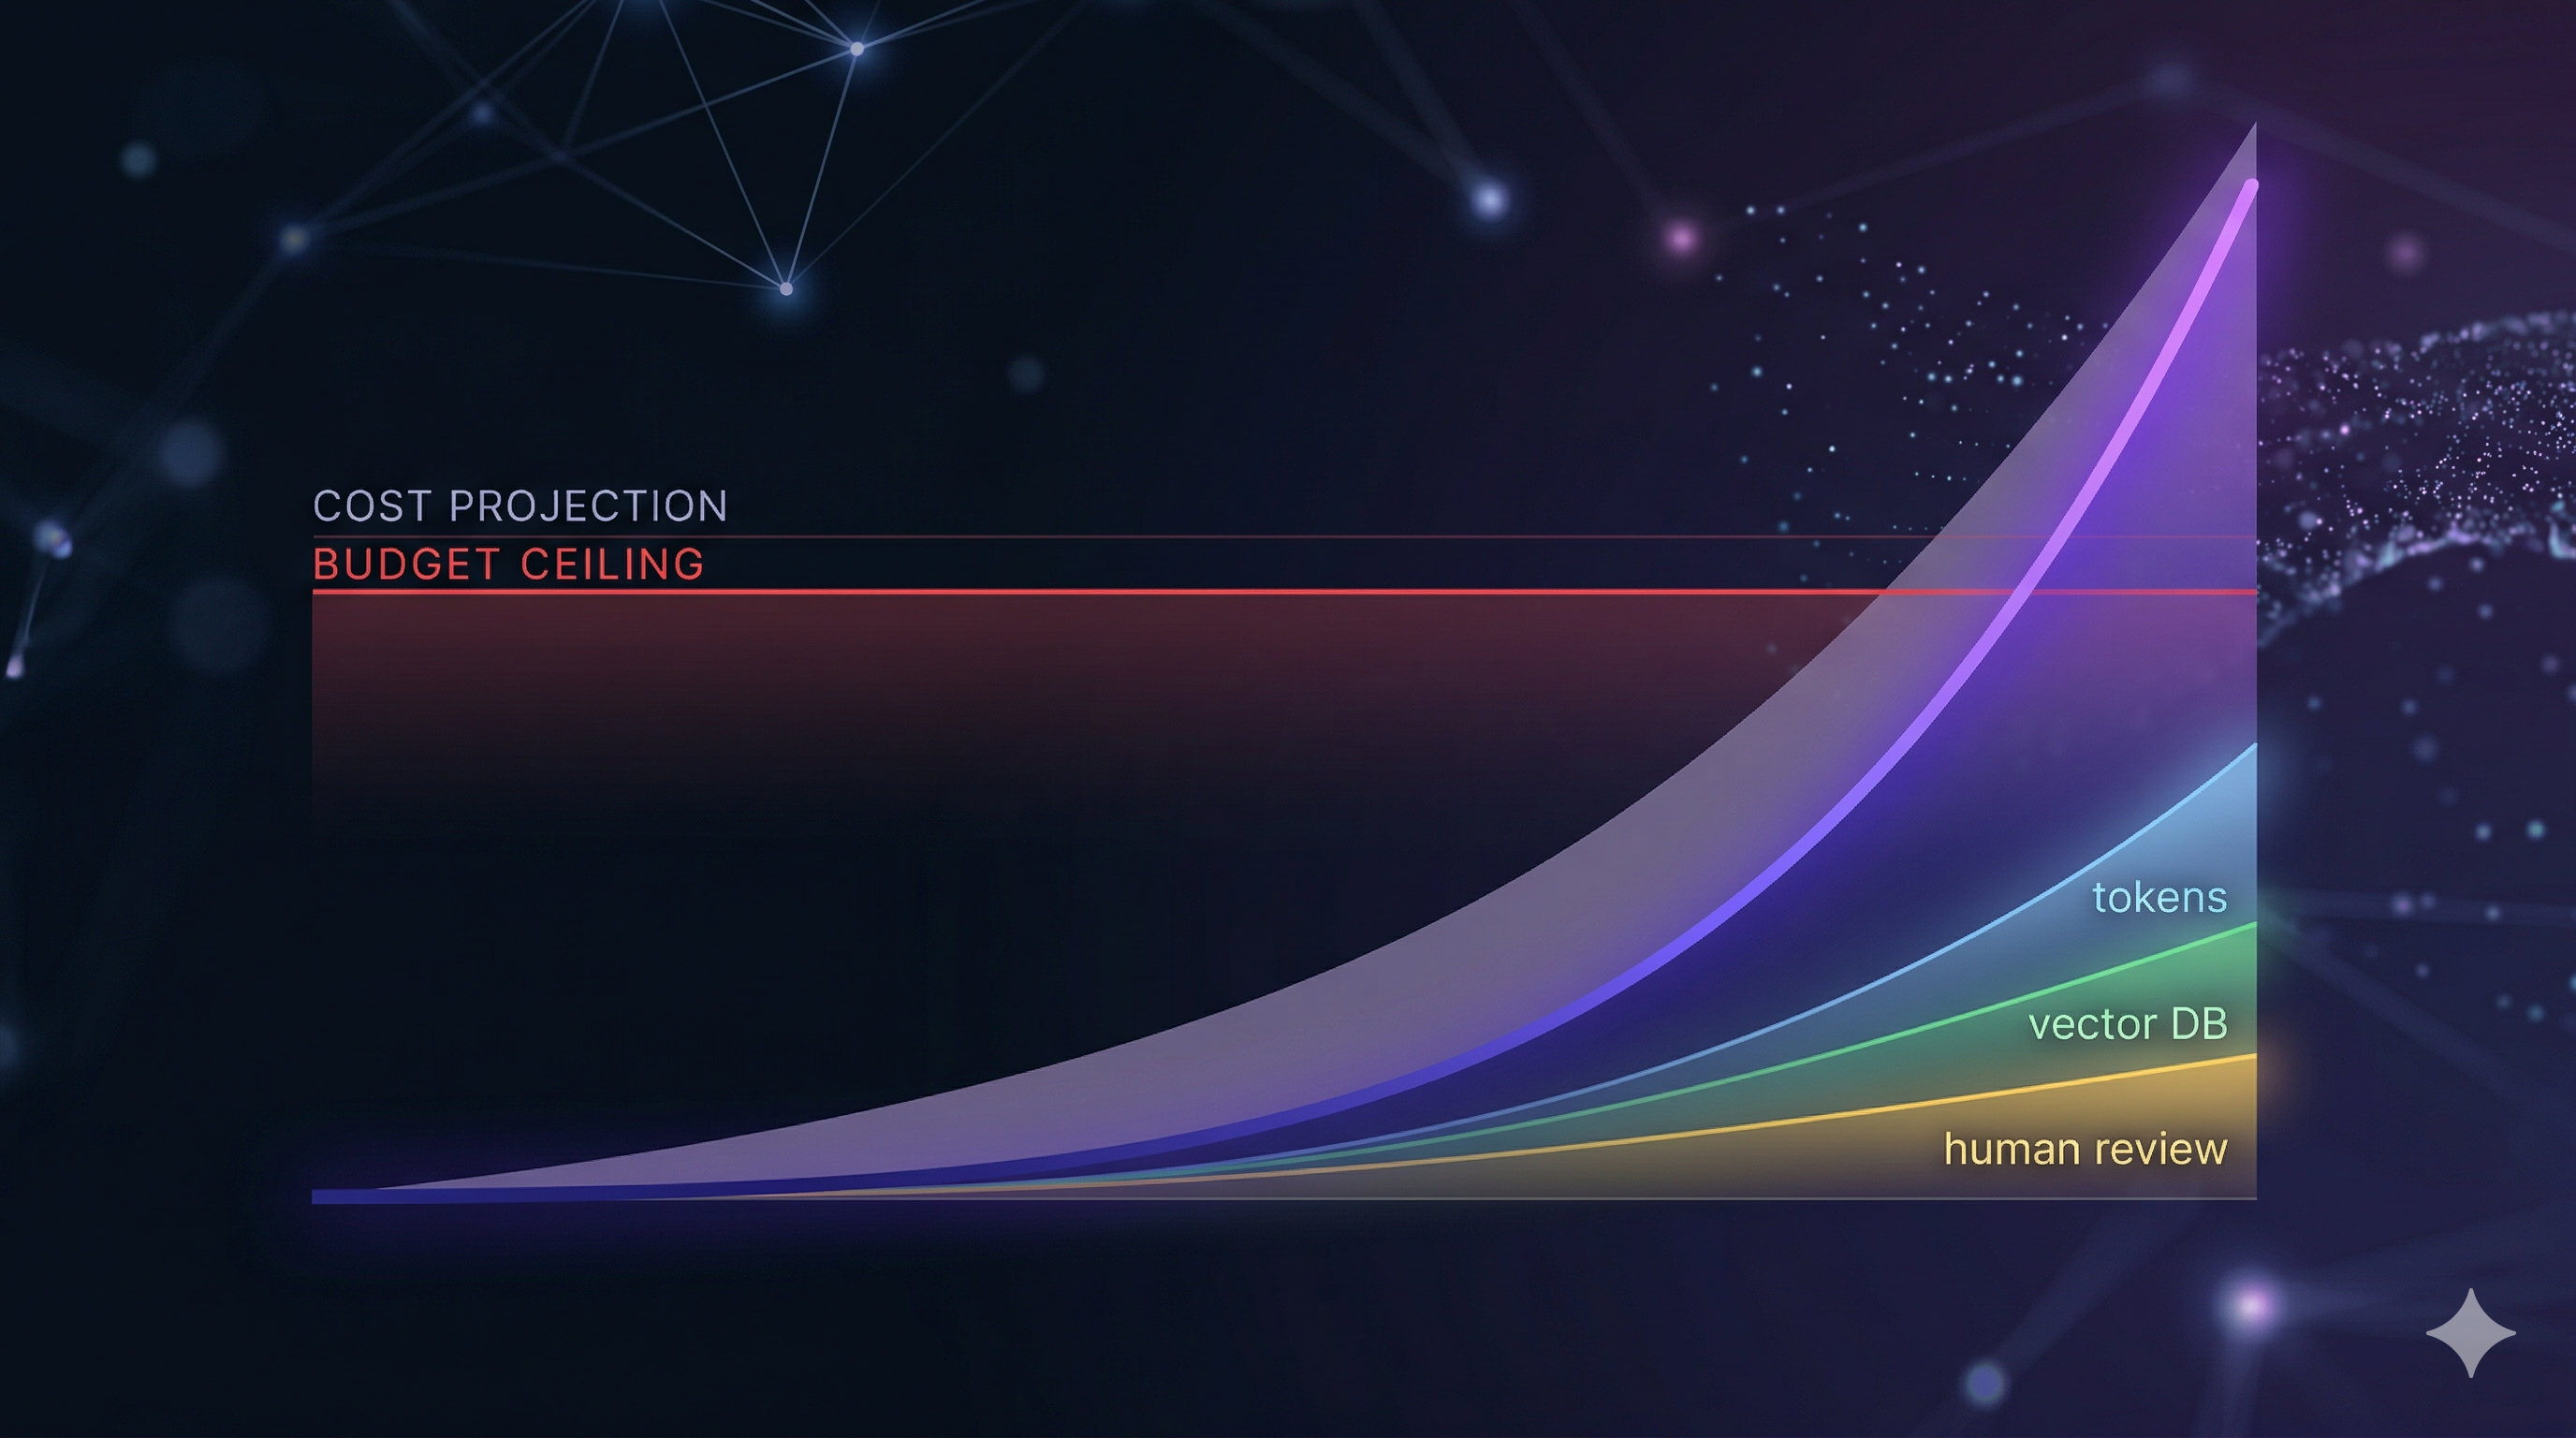
LLM token cost is the only component in most initial estimates. It scales directly with users, prompts per user, and token counts per prompt. At 15% monthly user growth, that base cost compounds to roughly 5x by month 12.
Vector database cost is the first surprise for RAG deployments. A 3-million-vector corpus with 15 million monthly queries adds cost that scales with both corpus size and query volume.
Human review cost is the second. Any customer-facing or regulated deployment will eventually require a percentage of outputs reviewed before action. This component typically does not appear in the initial estimate because the review workflow has not been built yet when the budget is submitted.
Evaluation pipeline cost is the third. Running evaluation runs to detect model drift adds a fixed monthly cost that is small relative to the other components but still compounds with everything else.
Cost volatility is the fifth factor and the most underappreciated. A 35% volatility parameter on a 15% monthly growth trajectory means the actual monthly cost is not a line but a band. The difference between P10 and P90 outcomes by month 12 can exceed a factor of 2. An annual budget set at P50 will be insufficient for roughly half the months in the back half of the year.
Executive Takeaway: If your AI budget is built from launch token cost alone, you are not approving an operating model. You are approving a partial estimate.
Here is what those layers look like in dollar terms for the Enterprise RAG configuration, before growth:
| Cost layer | Month 1 estimate | What drives it |
|---|---|---|
| LLM tokens only | ~$99K | 30K users × 50 prompts × token price |
| + Vector database | ~$99K | Minimal at 3M vectors / 15M queries |
| + Human review | ~$324K | 1.5M prompts × 5% × $3.00 per review |
| + Evaluation pipeline | ~$324K | Minimal at 10K runs |
| Month 12 at 15% growth (P50) | ~$460K–$550K | Compounds across all layers |
| Month 12 at 15% growth (P90) | ~$800K–$1M+ | Volatility band adds the rest |
The jump from $99K to $324K happens in a single governance decision: enabling human review. That decision is almost always made after the budget is approved.
The Tool
To make that cost stack concrete, the model below combines those layers into a 12-month risk envelope rather than a single launch-month estimate. Use the built-in guide inside the panel for a full explanation of each input.
The cost breakdown panel and Monte Carlo bands in the tool above make the leverage points explicit — where the risk is scale versus operational overhead, and how much of the annual total each layer represents. For RAG deployments with human review enabled, LLM tokens often represent less than half of total operational cost by month 12.
Budget Governance from the Model
The practical recommendation from this cost model is straightforward: initial AI infrastructure budgets should be set against the P90 cost trajectory, not the P50, with explicit line items for each operational layer that governance will eventually require.
- Budget at P90, not P50, for emerging AI workloads to absorb volatility.
- Line-item each operational layer separately, even if they aren’t scoped yet.
- Treat launch token cost as a baseline, not a total run-rate.
- Evaluate ROI against risk-adjusted cost, requiring a measured baseline to unlock further funding.
The ROI panel shows both raw and risk-adjusted figures. When projected benefit and annual cost are close — roughly $10M each in this configuration — raw ROI is near zero or slightly negative. The risk-adjusted figure applies a confidence multiplier based on evidence strength: an estimated baseline receives a 0.6 multiplier versus 0.9 for a measured one, compressing the effective benefit significantly. A negative risk-adjusted ROI signals that the business case needs one of three things: a measured baseline replacing the estimated one, a longer board-approved payback horizon, or a cost configuration that brings P50 below the benefit line before the next budget cycle.
Try It
The AI Cost Risk Analyzer is available in the Lab as a free, browser-based tool. No account required.
Enter the user count, prompt volume, and token estimates for the deployment under review. Toggle the operational layers that governance will eventually require, even if they have not been scoped yet. Adjust the growth rate and volatility to reflect realistic adoption patterns, not the launch-month baseline.
The P10 to P90 band and the cost breakdown section will show how much of the risk is driven by scale versus operational overhead, and where a budget buffer needs to be sized.
Before committing to build or buy, run those cost figures through the AI ROI Simulator to see how the operational cost trajectory affects the investment case over a three-year horizon.
In enterprise AI, the first bad budget is rarely caused by the model price. It is usually caused by treating an operational system like a token calculator.